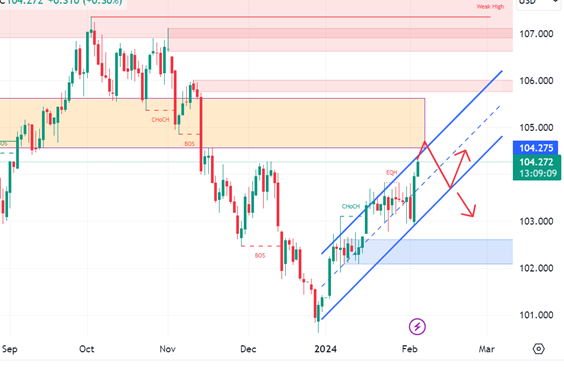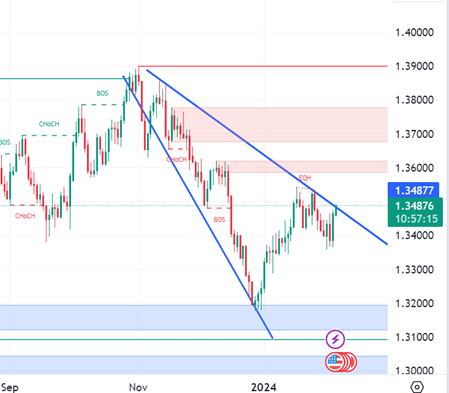
"DXY Chart Analysis: Bearish Momentum Suggests Short-Term Upside Followed by Potential Reversal” – Feb 05-09, 2024
The present DXY chart reveals a prevailing bearish
momentum, signaling a downward trajectory. As per the analysis, there is a
possibility of a short-term upward movement towards the initial resistance
before a reversal takes place, leading the price to decline towards the initial support level.
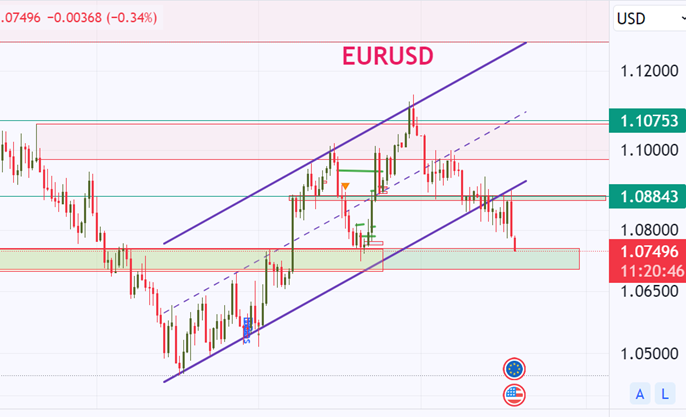
“EURUSD Faces Sharp Decline: Technical Analysis Signals Continued Bearish Momentum” - Feb 05-09, 2024
On Friday, the EURUSD experienced a significant decline of more than 1% following the release of the NFP report, reaching a nearly two-month low of 1.0766 today, aligning with the lower boundary of a bearish triangle.
The current market situation reveals the price trading below the 200-day simple moving average (SMA), with the 20- and 50-day SMAs acting as robust resistance levels due to a recent bearish crossover. The Relative Strength Index (RSI) is positioned below the neutral threshold of 50 and trending lower, indicating a bearish momentum. Additionally, the Moving Average Convergence Divergence (MACD) is strengthening its negative momentum below both its trigger and zero lines.
Anticipated further losses could lead the price to test the December 8 low of 1.0725, reinforcing the prevailing downward trend. A continued decline might push the price towards the 1.0655 support level, followed by the 1.0515 barricade, which originated from the low on November 1.
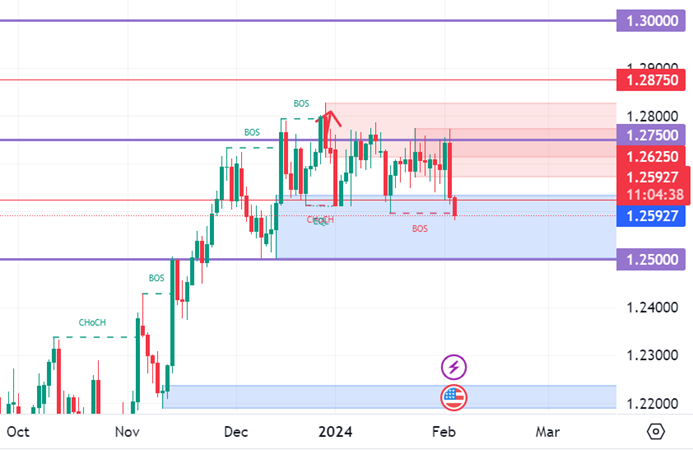
"Bullish Momentum in GBP/USD Chart: Support and Resistance Analysis Points to Potential Upside Movement" - Feb 05-09, 2024
The current analysis of the GBP/USD chart reveals a prevailing bullish momentum, signaling an upward trend. The price is anticipated to potentially undergo a bullish rebound from the first support level, moving towards the initial resistance.
The initial support level at 1.2596 is identified as an overlap support, strengthened by the presence of the 23.60% Fibonacci Retracement. This indicates its historical significance, suggesting it may serve as a robust support level where buying interest could emerge.
Additionally, a second support level at 1.2501 is characterized as overlap support, associated with the 38.20% Fibonacci Retracement, further emphasizing its importance as a potential support zone.
On the resistance front, the first resistance level at 1.2794 is labeled as an overlap resistance, signifying its historical significance as a point where the price has encountered resistance in the past.
Furthermore, a second resistance level at 1.2960 is identified as a swing-high resistance, suggesting it represents another historical level where the price has historically faced resistance.
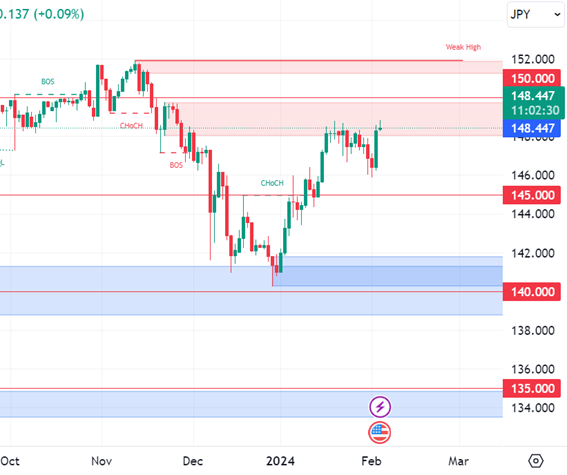
"USD/JPY Chart Analysis: Bearish Momentum Signals Potential Drop from Resistance Levels" Feb 05-09, 2024
In the current evaluation of the USD/JPY chart, a discernible bearish momentum is observed, indicating a prevailing downward trend. According to the analysis, there's a likelihood of a bearish reaction occurring at the first resistance level, leading the price to retreat toward the initial support.
The first support level at 144.01 is identified as overlap support and is further reinforced by the presence of the 50% Fibonacci Retracement, underscoring its historical significance. This suggests that it holds the potential to act as a robust support level where buying interest may emerge.
Additionally, a second support level at 140.94 is characterized as multi-swing low support, further emphasizing its significance as a potential support zone.
On the resistance front, the first resistance level at 148.19 is classified as an overlap resistance, indicating its historical relevance as a point where the price has encountered resistance in the past.
Furthermore, a second resistance level at 151.72 is identified as a multi-swing high resistance, suggesting another historical level where the price has historically faced resistance.
Intermediate support at 146.59 is also noted, marked as overlap support with the presence of the 23.60% Fibonacci Retracement, adding a layer to the analysis.
"USD/CAD Analysis: Bullish Momentum Indicates Potential Upside Breakout"- Feb 05-09, 2024
Upon careful examination of the USD/CAD chart, a clear overall bullish momentum is evident. In this scenario, there's a conceivable opportunity for the price to initiate a bullish continuation towards the first resistance, contingent upon a successful break above the descending trendline.
The initial resistance level at 1.3520 is recognized as a pullback resistance, closely aligning with the 50.00% Fibonacci retracement level. Moving higher, the second resistance level at 1.3628 is identified as an overlap resistance, coinciding with the 61.80% Fibonacci retracement level. This dual alignment underscores its significance as a noteworthy potential resistance point.
On the downside, the initial support level at 1.3387 is characterized as an overlap support, closely aligning with the 50.00% Fibonacci Retracement level. Descending further, the second support level at 1.3185 is denoted as a swing-low support, highlighting its importance as a potential support zone.
In conclusion, the prevailing bullish momentum in the USD/CAD chart suggests the possibility of an upside breakout, with attention focused on key resistance and support levels for potential trading opportunities.
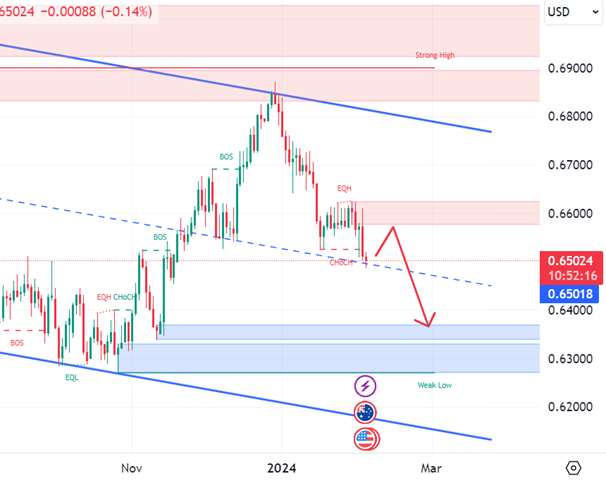
"AUD/USD Analysis: Bearish Momentum Indicates Potential Downward Move - Feb 05-09, 2024"
Upon assessing the current state of the AUD/USD chart, a prevailing overall bearish momentum is evident. Within this context, there's a plausible scenario where the price may decline toward the initial support, potentially experiencing a minor bullish rebound before resuming its downward trajectory.
The first support level at 0.6526 is recognized as an overlap support, closely aligning with the 61.80% Fibonacci retracement level. Descending further, the second support level at 0.6467 is also identified as pullback support, closely aligning with the 78.60% Fibonacci Retracement level. This dual alignment underscores its significance as a noteworthy potential support zone.
On the upside, the initial resistance level at 0.6637 is denoted as a pullback resistance. Moving higher, the second resistance level at 0.6690 is marked as an overlap resistance, further emphasizing its importance as a potential point of resistance.
In summary, the prevalent bearish momentum in the AUD/USD chart suggests a potential downward move, with attention directed toward key support and resistance levels for potential trading strategies.
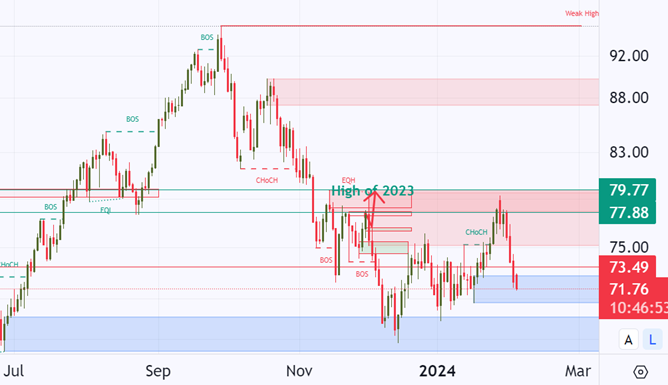
"WTI Crude Oil Analysis: Bearish Momentum Prompts Potential Downside Break - Feb 05-09, 2024"
A comprehensive analysis of the WTI (West Texas Intermediate) chart reveals a distinct bearish momentum, setting the stage for a potential downward move. In this scenario, there's a conceivable situation where the price may decline towards the initial support, contingent upon a break below the ascending trendline.
The intermediate support level at 70.51 is acknowledged as pullback support, aligning precisely with the 78.60% Fibonacci retracement level. Concurrently, the first support level at 67.81 is recognized as a multi-swing-low support, emphasizing its importance as a pivotal level of support.
On the upside, the initial resistance level at 78.30 is designated as an overlap resistance, coinciding with the 50.00% Fibonacci retracement level. This alignment underscores its significance as a potential resistance point.
In summary, the prevailing bearish momentum in the WTI Crude Oil chart suggests a possible downside break, with attention focused on critical support and resistance levels for strategic trading considerations.
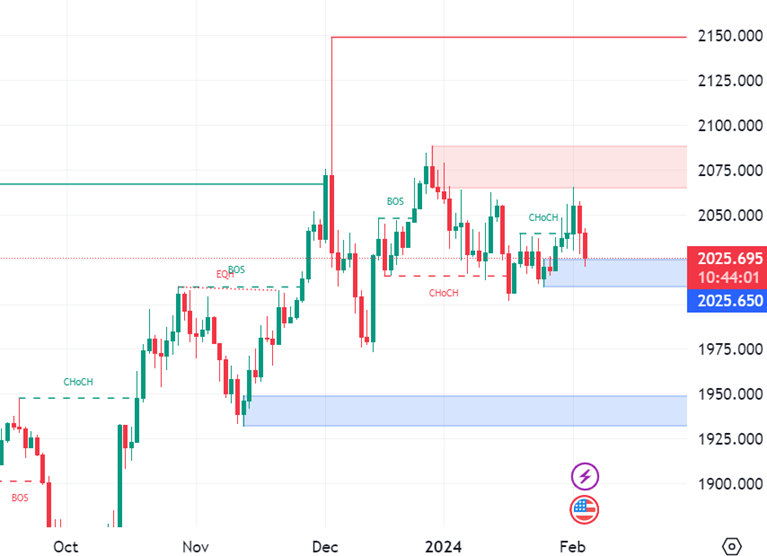
"Navigating Gold's (XAU/USD) Current Trends: Bearish Signals and Potential Support Levels"
The current evaluation of the XAU/USD chart reveals an evident bearish momentum, signaling a prevailing downward trend. As per the analysis, there is a likelihood of the price continuing its bearish trajectory towards the initial support.
The first support level at 2006.30 is recognized as an overlap support, indicating its historical significance as a point where the price has historically found support.
Additionally, a second support level at 1977.81 is characterized as a swing low support, associated with the 50% Fibonacci Retracement. This aspect further underscores its importance, suggesting it serves as a potential support zone.
On the resistance front, the initial resistance level at 2975.28 is classified as an overlap resistance, signifying its historical relevance as a point where the price has encountered resistance.
In summary, the observed bearish momentum in the Gold (XAU/USD) chart implies a potential continuation of the downside move, with attention directed towards crucial support and resistance levels for strategic trading considerations.